+34 9340006100 -ext. 437807-info@nanbiosis.com


Scientific leader: Carles Arús This service allows for selection from a panoply of therapeutic agentsfor gliblastoma, to ensure that only the best ones will reach the most advanced phases. This service offered by NANBIOSIS allows a path for analysis of potential therapeutic agents to be used in glioblastoma. It is a preliminary effectiveness assessment of new therapeutic agents in an immunocompetent preclinical glioblastoma model. It includes in vitro effects over GL261 cultured cells (e.g. EC50 calculation), target validation (e.g. protein kinase CK2 inhibition when using CK2 inhibitors), preliminary studies of 1-month toxicity and maximum tolerated doses, as well as complete in vivostudies for adjusting doses and periodicity for administration. These would allow estimation of classical survival (endpoint validation) and the evaluation of biomarkers of therapy response, either by MRI (RANO, RECIST) or by surrogate biomarkers detected by magnetic resonance spectroscopic imaging. For this, an immunocompetent murine model of glioblastoma will be used( GL261 tumorsgrowing in C57BL/6background). Ref: Ferrer-Font L, Villamañan L, Arias-Ramos N, Vilardell J, Plana M, Ruzzene M, Pinna LA, Itarte E, Arús C, Candiota AP (2017) Targeting Protein Kinase CK2: Evaluating CX-4945 Potential for GL261 Glioblastoma Therapy in Immunocompetent Mice. Pharmaceuticals 10 (1):24 Services involved:
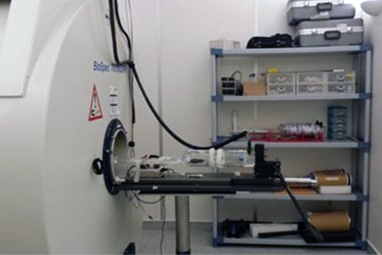
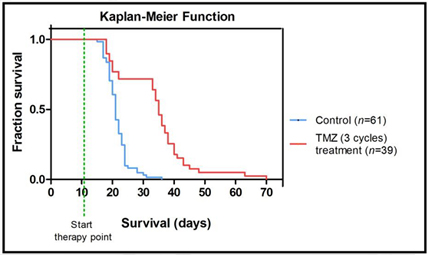
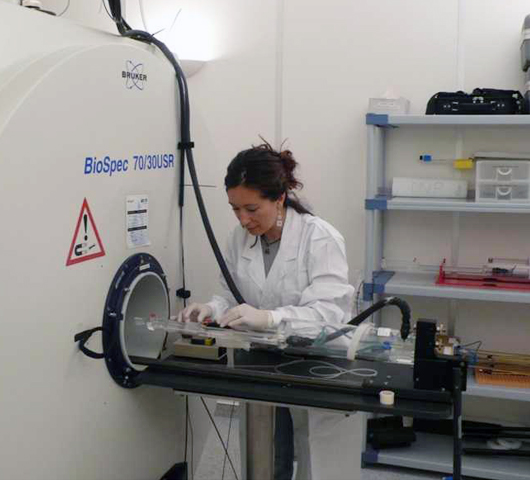
Figure U25 (1): Biospec 7T scanner, in which MR proposed studies will be performed, with the mouse bed assembly. Figura U25 (2): Kaplan-Meier survival curve with temozolomide (TMZ) treated and control mice, showing clear difference, statistically significant, between groups.
Scientific Coordinator: Ana Paula CandiotaIndustrial problem/gap covered
Description
Example of this solution is described in the following publication:
(1)Chou, T.C., Drug combination studies and their synergy quantification using the Chou-Talalay method.Cancer Res, 2010.70(2): p. 440-6
(1)Vogelbaum, M.A., et al., Application of novel response/progression measures for surgically delivered therapies for gliomas: Response Assessment in Neuro-Oncology (RANO) Working Group.Neurosurgery, 2012. 70(1): p. 234-43
(1)Eisenhauer, E.A., et al., New response evaluation criteria in solid tumours: revised RECIST guideline (version 1.1).Eur J Cancer, 2009. 45(2): p. 228-47
(1)Qin, L., et al., Advanced MRI assessment to predict benefit of anti-programmed cell death 1 protein immunotherapy response in patients with recurrent glioblastoma.Neuroradiology, 2017. doi: 10.1007/s00234-016
(1)Delgado-Goñi, T., et al., MRSI-based molecular imaging of therapy response to temozolomide in preclinical glioblastoma using source analysis.NMR Biomed, 2016. 29(6): p. 732-743.